Cluster Monitoring in Loft
Loft provides direct integration with Grafana and you can view any Grafana dashboard directly in Loft. With the recommended app kube-prometheus-stack, a complete monitoring setup can be enabled in your cluster with a single click. Grafana itself is the most popular technology used to compose observability dashboards with everything from Prometheus and Graphite metrics, to logs and application data to power plants and beehives.
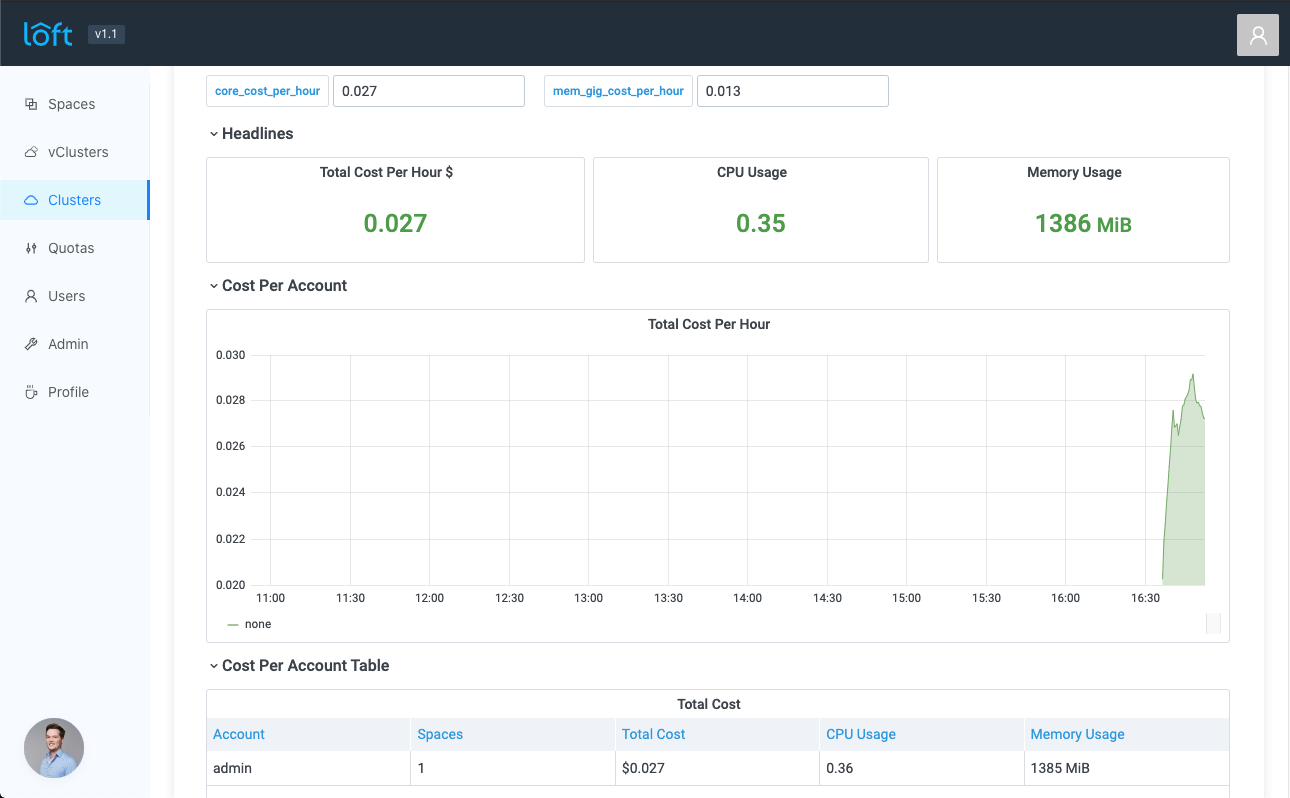
Loft provides additional custom Grafana dashboards for easier cost, account, and resource tracking.
1. Install kube-prometheus-stack
Navigate to Clusters -> CLUSTER -> Overview and click on the recommended app kube-prometheus-stack.
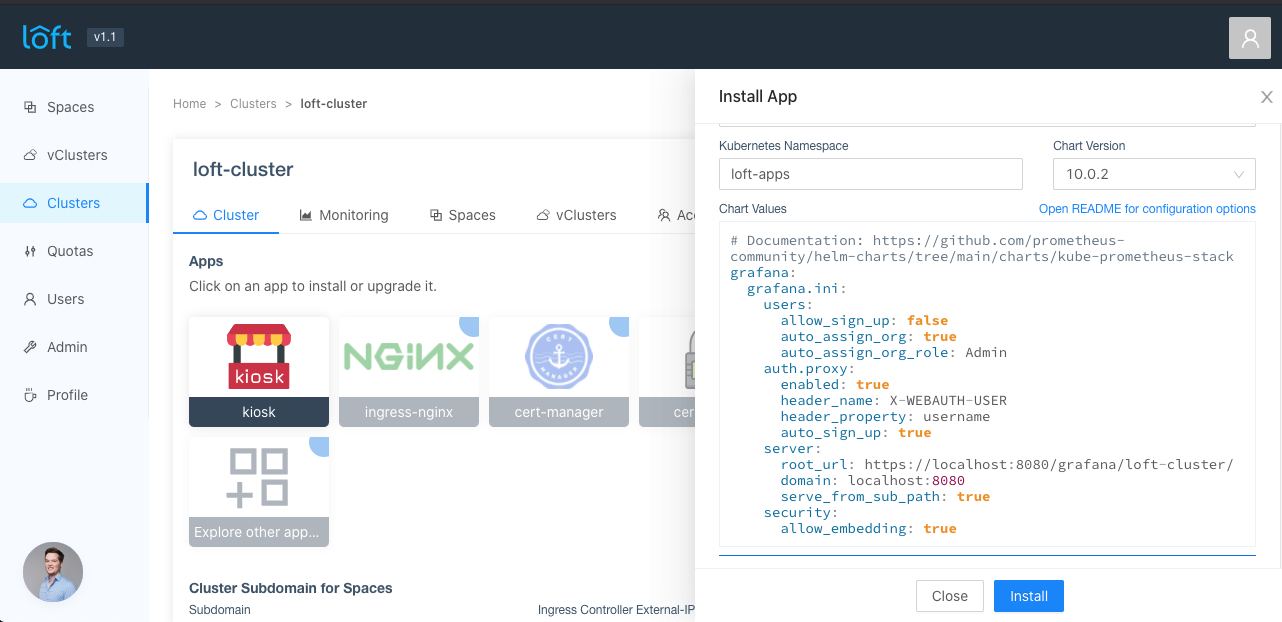
In the app values, make sure the values for grafana.grafana.ini.server.root_url and grafana.grafana.ini.server.domain are correct. You can also add any values the chart kube-prometheus-stack supports:
# Required values by Loft
grafana:
  grafana.ini:
    auth.proxy:
      auto_sign_up: true
      enabled: true
      header_name: X-WEBAUTH-USER
      header_property: username
    security:
      allow_embedding: true
    server:
      # CHANGE THIS
      domain: ${DOMAIN_WHERE_LOFT_IS_REACHABLE}
      # CHANGE THIS
      root_url: https://${DOMAIN_WHERE_LOFT_IS_REACHABLE}/grafana/${LOFT_CLUSTER_NAME}/
      serve_from_sub_path: true
    users:
      allow_sign_up: false
      auto_assign_org: true
      auto_assign_org_role: Admin
If you already have a Prometheus installation, you can also just install the Grafana chart with the above values without the initial grafana prefix.
After pressing Install, please be patient until the kube-prometheus-stack is installed.
2. Install Loft Grafana dashboards (optional)
To install the additional Loft Grafana dashboards, navigate to Clusters -> CLUSTER -> Overview and click on the recommended app loft-grafana-dashboards.
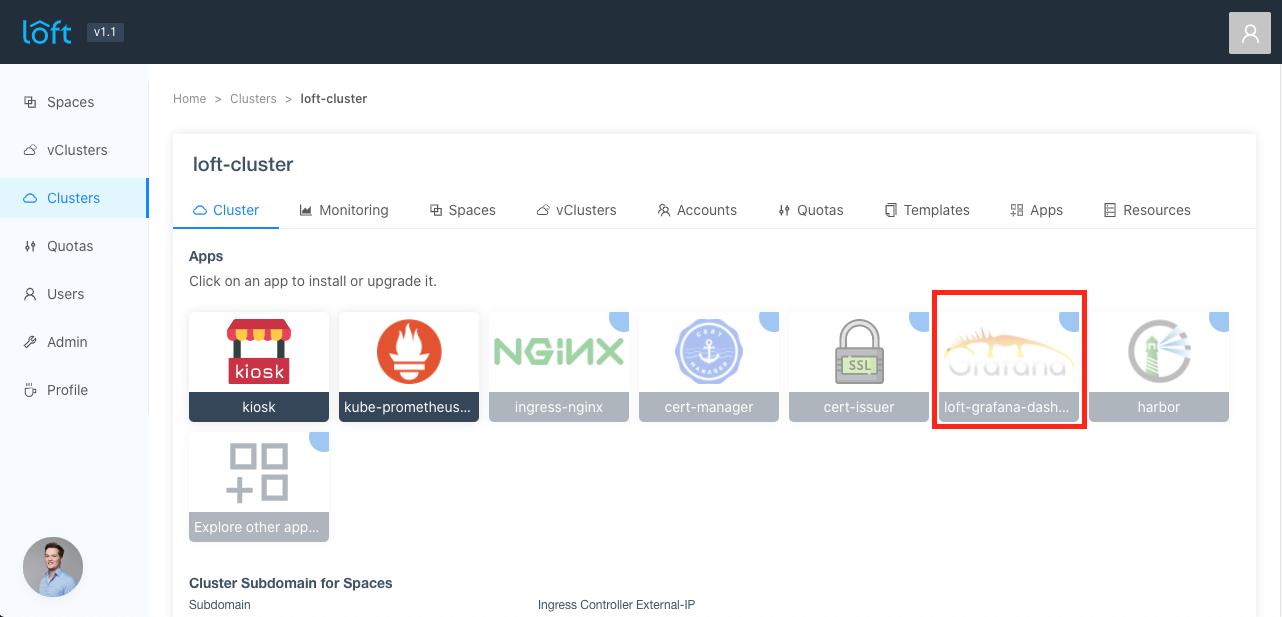
The Loft dashboards can only be discovered by Grafana if you install them into the same namespace as you installed the kube-prometheus-stack.
3. Viewing Grafana dashboards in Loft
After installing the kube-prometheus-stack with Grafana, you can select the discovered Grafana dashboards in the view Clusters -> CLUSTER -> Monitoring. There should be several dashboards you can select from. After selecting a dashboard, the dashboard is shown below.
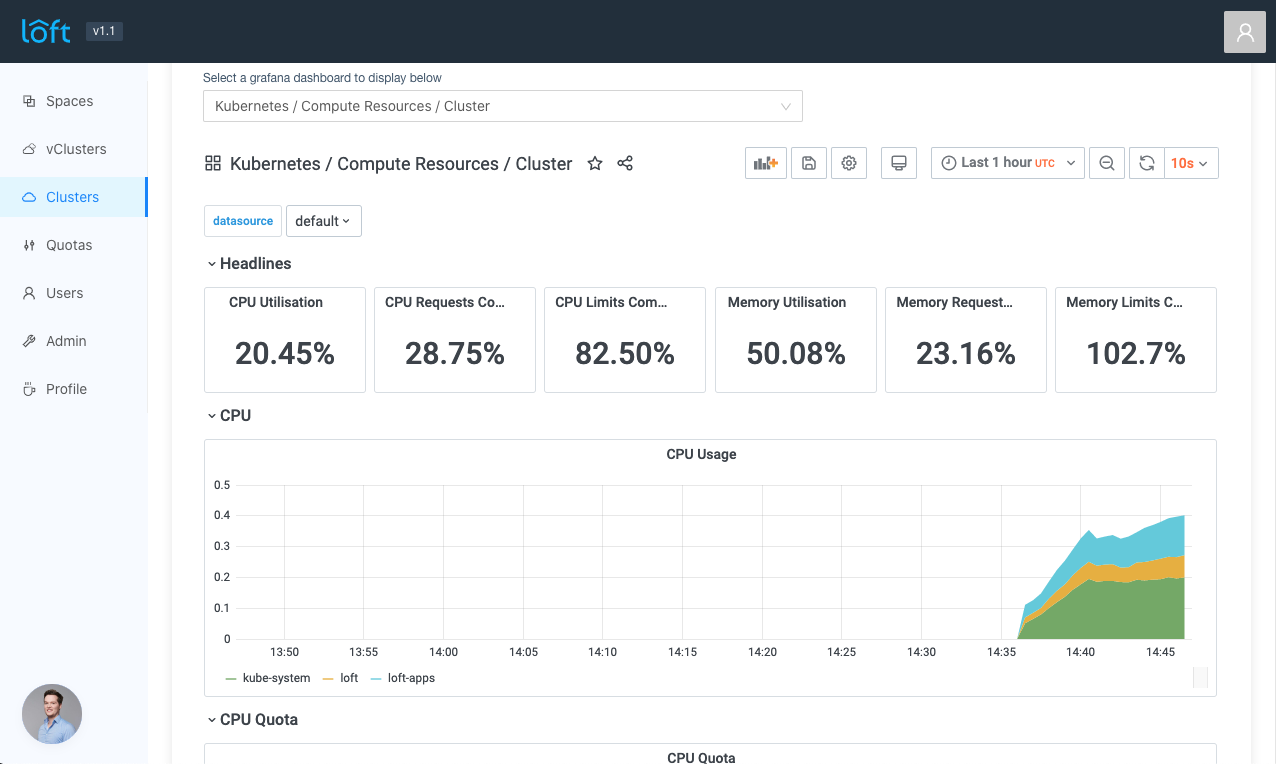
It may be possible that sometimes a panel appears to be empty. This can happen if Grafana does not recognize the iframe height change fast enough. The panel and all other empty panels should be shown after collapsing and expanding the empty panel.
Congratulations, you now have a fully fledged monitoring setup with Loft, Prometheus, and Grafana!
