Aggregating Metrics
This document provides a guide on configuring OpenTelemetry with Prometheus to collect workload metrics from across multiple vClusters and aggregate by Project, vCluster, and Space. This approach utilizes shared OpenTelemetry DaemonSets on the Host Cluster without requiring individual collector installations per vCluster.
Prerequisites:
- Prometheus deployed and reachable from all connected clusters with the OTLP-reciever feature flag enabled.
Deploy OpenTelemetry Collector on each Host Cluster
Deploy the built-in OpenTelemetry App on each connected Host Cluster. This OpenTelemetry App accepts the Prometheus connection information and deploys opentelemetry-collector as a Daemonset via Helm.
The OpenTelemetry Collector Agent on each node will push metrics about the workloads running on that node to the Prometheus instance. The metrics will have the vCluster, Loft Platform and Kubernetes metadata associated with the workloads as labels.
- Go to the Clusters dropdown using the menu on the left, and select the Clusters view.
- Click on the Cluster where you are installing the Opentelemetry Collector App.
- Navigate to the Apps tab.
- Click on the OpenTelemetry Collector App.
- Enter the Prometheus connection endpoint and auth info as prompted.
- Click on the button to finish.
Create Prometheus Queries
Now that we’ve started collecting data with OpenTelemetry, we can aggregate the metrics using the associated labels like the vCluster name.
Here’s an example Prometheus query showing the CPU usage aggregated by the vCluster name:
sum by(loft_virtualcluster_name) (k8s_pod_cpu_time_seconds_total{loft_virtualcluster_name=~".+"})`
List of available labels from Loft:
loft_project_nameloft_virtualcluster_nameloft_space_nameloft_cluster_name.
Create Grafana Dashboard
Prerequisites:
- Grafana isntance connected to the Prometheus instance.
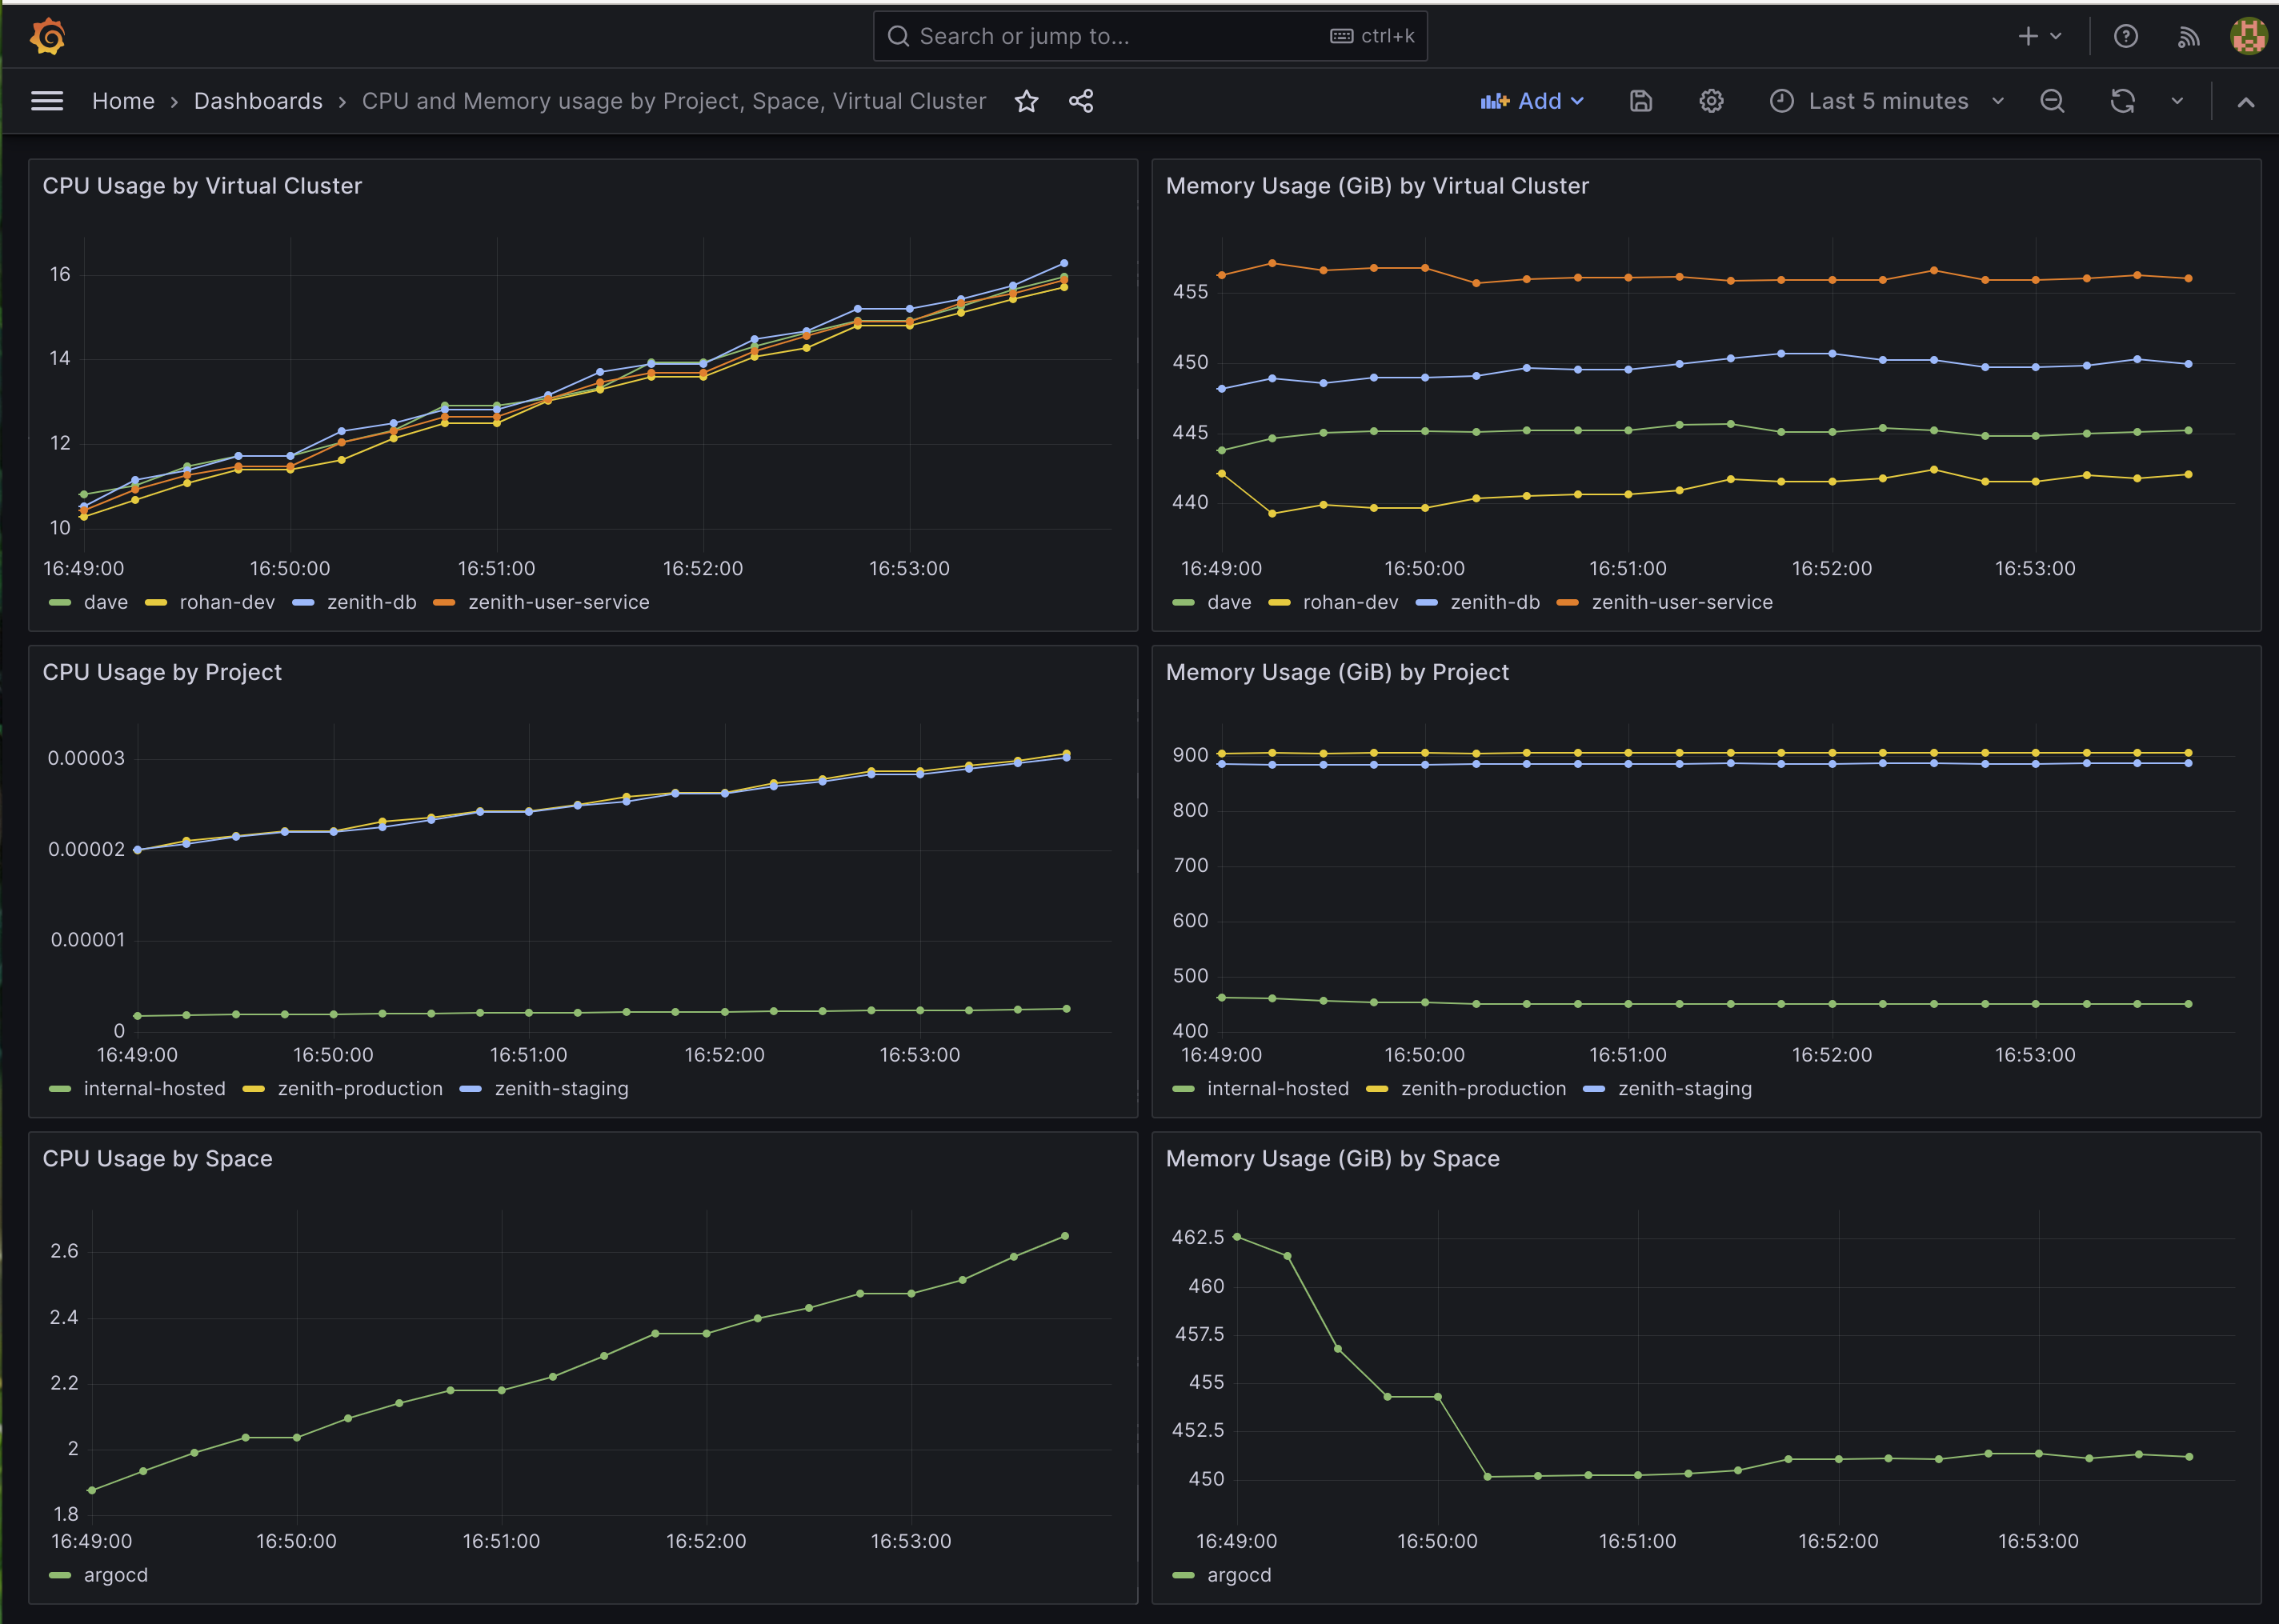
Let’s demonstrate how these aggregated metrics would look using Grafana. This example dashboard will visualize the CPU and Memory usage aggregated by vCluster, Project and Space.
You can then import the example Dashboard JSON below by copying it into the Grafana interface.
{
  "title": "CPU and Memory usage by Project, Space, Virtual Cluster",
  "panels": [
    {
      "gridPos": {
        "h": 8,
        "w": 12,
        "x": 0,
        "y": 0
      },
      "id": 3,
      "options": {
        "legend": {
          "calcs": [],
          "displayMode": "list",
          "placement": "bottom",
          "showLegend": true
        }
      },
      "targets": [
        {
          "disableTextWrap": false,
          "editorMode": "code",
          "expr": "sum by(loft_virtualcluster_name) (k8s_pod_cpu_time_seconds_total{loft_virtualcluster_name=~\".+\"})",
          "fullMetaSearch": false,
          "includeNullMetadata": true,
          "instant": false,
          "legendFormat": "__auto",
          "range": true,
          "refId": "A",
          "useBackend": false
        }
      ],
      "title": "CPU Usage by Virtual Cluster",
      "type": "timeseries"
    },
    {
      "gridPos": {
        "h": 8,
        "w": 12,
        "x": 12,
        "y": 0
      },
      "id": 4,
      "options": {
        "legend": {
          "calcs": [],
          "displayMode": "list",
          "placement": "bottom",
          "showLegend": true
        }
      },
      "targets": [
        {
          "disableTextWrap": false,
          "editorMode": "code",
          "expr": "sum by (loft_virtualcluster_name) (k8s_pod_memory_usage_bytes{loft_virtualcluster_name=~\".+\"})\n/1024/1024",
          "fullMetaSearch": false,
          "includeNullMetadata": true,
          "instant": false,
          "legendFormat": "__auto",
          "range": true,
          "refId": "A",
          "useBackend": false
        }
      ],
      "title": "Memory Usage (GiB) by Virtual Cluster",
      "type": "timeseries"
    },
    {
      "gridPos": {
        "h": 8,
        "w": 12,
        "x": 0,
        "y": 8
      },
      "id": 2,
      "options": {
        "legend": {
          "calcs": [],
          "displayMode": "list",
          "placement": "bottom",
          "showLegend": true
        }
      },
      "targets": [
        {
          "disableTextWrap": false,
          "editorMode": "builder",
          "expr": "sum by(loft_project_name) (k8s_pod_cpu_time_seconds_total{loft_project_name=~\".+\"}) / 1024 / 1024",
          "fullMetaSearch": false,
          "includeNullMetadata": true,
          "instant": false,
          "interval": "",
          "legendFormat": "__auto",
          "range": true,
          "refId": "A",
          "useBackend": false
        }
      ],
      "title": "CPU Usage by Project",
      "type": "timeseries"
    },
    {
      "gridPos": {
        "h": 8,
        "w": 12,
        "x": 12,
        "y": 8
      },
      "id": 1,
      "options": {
        "legend": {
          "calcs": [],
          "displayMode": "list",
          "placement": "bottom",
          "showLegend": true
        }
      },
      "targets": [
        {
          "disableTextWrap": false,
          "editorMode": "code",
          "expr": "sum by (loft_project_name) (k8s_pod_memory_usage_bytes{loft_project_name=~\".+\"})\n/1024/1024",
          "fullMetaSearch": false,
          "includeNullMetadata": true,
          "instant": false,
          "legendFormat": "__auto",
          "range": true,
          "refId": "A",
          "useBackend": false
        }
      ],
      "title": "Memory Usage (GiB) by Project",
      "type": "timeseries"
    },
    {
      "gridPos": {
        "h": 8,
        "w": 12,
        "x": 0,
        "y": 16
      },
      "id": 6,
      "options": {
        "legend": {
          "calcs": [],
          "displayMode": "list",
          "placement": "bottom",
          "showLegend": true
        }
      },
      "targets": [
        {
          "disableTextWrap": false,
          "editorMode": "code",
          "expr": "sum by(loft_space_name) (k8s_pod_cpu_time_seconds_total{loft_space_name=~\".+\"})",
          "fullMetaSearch": false,
          "includeNullMetadata": true,
          "instant": false,
          "legendFormat": "__auto",
          "range": true,
          "refId": "A",
          "useBackend": false
        }
      ],
      "title": "CPU Usage by Space",
      "type": "timeseries"
    },
    {
      "gridPos": {
        "h": 8,
        "w": 12,
        "x": 12,
        "y": 16
      },
      "id": 5,
      "options": {
        "legend": {
          "calcs": [],
          "displayMode": "list",
          "placement": "bottom",
          "showLegend": true
        }
      },
      "targets": [
        {
          "disableTextWrap": false,
          "editorMode": "code",
          "expr": "sum by (loft_space_name) (k8s_pod_memory_usage_bytes{loft_space_name=~\".+\"})\n/1024/1024",
          "fullMetaSearch": false,
          "includeNullMetadata": true,
          "instant": false,
          "legendFormat": "__auto",
          "range": true,
          "refId": "A",
          "useBackend": false
        }
      ],
      "title": "Memory Usage (GiB) by Space",
      "type": "timeseries"
    }
  ],
  "schemaVersion": 38
}
